Exercise 1
| Plummet Increase
Peak Soar Rocket Fluctuate Level out Drop Decrease Decline Rise Fall |
The verbs in the box on the right can all be used to describe changes commonly represented on line graphs. Use your dictionary to look up the meanings of the verbs and then answer the following questions:
- Which 5 verbs mean go up?
- Of these, which 3 mean go up suddenly/a lot?
- Which 5 verbs mean go down?
- Which verb means reach its highest level?
- Which verb means stay the same?
- Which verb means go up and down?
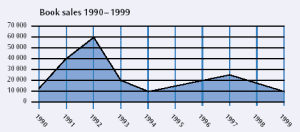
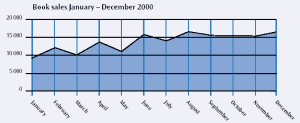
Now decide which parts of the graphs below, showing the sales of a book between 1990 and 2000, can be described using the verbs given.
Exercise 2
Now, using the verbs above, complete these sentences using the information shown on the graphs:
1 In the year 2000, sales _____ at the beginning of August.
2 Sales rocketed between 19_____ and 19_____ .
3 From 1992 to 1993, sales of the book _____ .
4 Book sales fluctuated between _____ and _____ 2000.
5 Sales _____ between September and November 2000.
6 Sales started to fall for the first time in 19_____ .
7 Book sales _____ from 1994 to 1997.
8 However, from 1997 to 1999, sales _____ .
Exercise 3
Changes can also be described in more detail by modifying a verb with an adverb. Using a verb from the box on the left, and an adverb from the box on the right, make sentences describing the changes represented on the line graphs above for the years or months shown. The first one has been done for you as an example.
| Slightly Slowly Sharply
Rapidly Steadily Gradually Moderately Dramatically |
| Increase Fall
Decrease Rise Decline Drop |
1990-–1992
Sales increased/rose dramatically/sharply.
- 1992-–1994
- 1994-–1997
- 1997-–1999
- July – August 2000
- November–December 2000