Author: patronellamaroale

  • Learning Outcomes
    · Situations or issues that can be dealt with through statistical methods are identified correctly.

    · Appropriate methods for collecting, recording, and organizing (data are used to maximize efficiency and ensure the resolution of a problem or issue

    · Data sources and databases are selected in a manner that ensures the representativeness of the sample and the validity of resolutions.

    · Activities that could result in the contamination of data are identified and explanations are provided of the effects of contaminated data.

    · Data is gathered using methods appropriate to the data type and purpose for gathering the data.

    · Data collection methods are used correctly.

    · Calculations and the use of statistics are correct.

    · Graphical representations and numerical summaries are consistent with the data and are clear and appropriate to the situation and target audience.

    · Resolutions for the situation or issue are supported by the data and are validated in terms of the context


    Interpreting and analyzing data are problem-solving processes essential for dealing with the information presented in many different forms, including but not limited to graphs and tables. Visual displays of data are found in reports and the media, often being used to make decisions or to determine whether to support or reject arguments.

    A Problem-Solving Process

    The word statistics may bring to mind polls and surveys, or facts and figures in a newspaper article. But statistics is more than just a bunch of numbers: Statistics is a problem-solving process that seeks answers to questions through data.

    By asking and answering statistical questions, we can learn more about the world around us. Statistics is used every day to help us gain insight into questions that affect our lives: Is our population growing or shrinking? What is the safest way to invest money? Will eating more fruits and vegetables make us live longer?

    What do you think of when you hear the word statistics?

    Four things make a problem statistical: how you ask the question, the role and nature of the data, the particular ways in which you examine the data, and the types of interpretations you make from the investigation. A statistics problem typically contains four components:

    Asking a question gets the process started. It’s important to ask a question carefully, with an understanding of the data you will use to find your answer. The question is most frequently derived from a problem situation and therefore can be seen as the core focus for the modeling of the data.

    Collecting data to help answer the question is an important step in the process. You obtain data by measuring something, gathering relevant information about blew the situation, or even through sampling which I, another collect data. Experimentation is another.

    Data must be organized, summarized, and represented properly to provide good answers to statistical questions. Also, the data you collect usually vary (i.e., they are not all the same), and you will need to account for the sources of this variation. The integrity of the source is of utmost importance to ensure an accurate analysis.

    After you analyze your data, you must interpret it to provide an answer — or answers — to the original question or problem situation.

    You will become increasingly familiar with this process as you investigate different statistical problems.

    From the recognition of trends to extracting patterns and extrapolating from data are higher-order problem-solving components of data interpretation and analysis. Therefore, before we can start to analyze data we need to understand how to collect the information, organize it effectively, and then present it in an easy-to-understand format.


    Many forms of models could be used to present and display information for analysis. Selecting the correct one could be critical to ensure that the application information can be analyzed effectively.

    Let’s have a look at a few of these examples. As you go through the examples with your facilitator, discuss other possible applications for the use of the models.

    Line Graphs

    A line graph is a way to summarize how two pieces of information are related and how they vary depending on one another. The numbers along a side of the line graph are called the scale.

    Example 1:
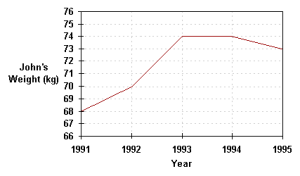
    Description: The graph above shows how John’s weight varied from the beginning of 1991 to the beginning of 1995. The weight scale runs vertically, while the time scale is on the horizontal axis. Following the gridlines up from the beginning of the years, we see that John’s weight was 68 kg in 1991, 70 kg in 1992, 74 kg in 1993, 74 kg in 1994, and 73 kg in 1995. Examining the graph also tells us that John’s weight increased between 1991 and 1995, stayed the same during 1991, and fell during 1994.

    Use:


    Pie Charts

    A pie chart is a circle graph divided into pieces, each displaying the size of some related piece of information. Pie charts are used to display the sizes of parts that make up some whole.

    Example 1:

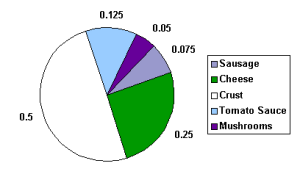
    The pie chart below shows the ingredients used to make a sausage and mushroom pizza. The fraction of each element by weight is shown in the pie chart below. We see that half of the pizza’s weight comes from the crust. Note that the sum of the decimal sizes of each slice is equal to 1 (the “whole” pizza”). 
    Example 2:

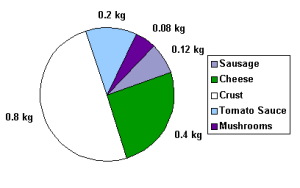
    The pie chart below shows the ingredients used to make a sausage and mushroom pizza weighing 1.6 kg. This is the same chart as above, except that the labels no longer tell the fraction of the pizza made up by that ingredient, but the actual weight in kg of the ingredient used. To get the fraction of the pizza made up of any ingredient, divide the weight of the ingredient by the weight of the pizza. What fraction of the pizza does the sausage make up? We divide 0.12 kg by 1.6 kg, to get 0.075. This is the same value as in the pie chart in the previous
    Example 3:

    The pie chart below shows the ingredients used to make a sausage and mushroom pizza. The fraction of each element by weight shown in the pie chart below is now given as a percent. Again, we see that half of the pizza’s weight, 50%, comes from the crust. Note that the sum of the percent sizes of each slice is equal to 100%. Graphically, the same information is given, but the data labels are different. Always be aware of how any chart or graph is labeled.

    Use:


    Bar Graphs

    Bar graphs consist of an axis and a series of labeled horizontal or vertical bars that show different

    values for each bar. The numbers along a side of the bar graph are called the scale.

    Example 1:

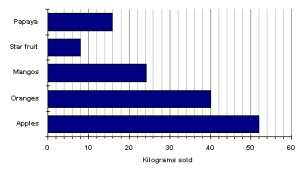
    The bar chart below shows the weight in kilograms of some fruit sold one day by a local market. We can see that 52 kg of apples were sold, 40 kg of oranges were sold, and 8 kg of star fruit were sold.


    Example 2:

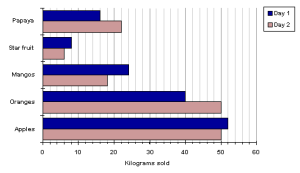
    A double bar graph is similar to a regular bar graph but gives 2 pieces of information for each item on the vertical axis, rather than just 1. The bar chart below shows the weight in kilograms of some fruit sold on two different days by a local market. This lets us compare the sales of each fruit over 2 days, not just the sales of one fruit compared to another. We can see that the sales of star fruit and apples stayed nearly the same. The sales of oranges increased from day 1 to day 2 by 10 kilograms. The same amount of apples and oranges was sold on the second day.
     

    Uses:
     
     
  •  

    PURPOSE:


    This Unit Standard is designed to provide credits toward the mathematical literacy requirement of the NQF at Level 4. The essential purposes of the mathematical literacy requirement are that, as the learner progresses with confidence through the levels, the learner will grow in:

    Confident, insightful use of mathematics in the management of the needs of everyday living to become a self-managing person

    An understanding of mathematical applications that provides insight into the learner`s present and future occupational experiences `and so develop into a contributing worker

    The ability to voice a critical sensitivity to the role of mathematics in a democratic society and become a participating citizen.

    People credited with this unit standard can:

    Critique and use techniques for collecting, organizing, and representing data.

    Use theoretical and experimental probability to develop models, make predictions, and study problems.

    Critically interrogate and use probability and statistical models in problem-solving and decision-making in real-world situations.


    LEARNING ASSUMED TO BE IN PLACE:
    The credit value is based on the assumption that people starting to learn towards this unit standard are competent in Mathematical Literacy and Communications at NQF level 3.
  • ASSESSMENT PLAN

    ASSESSMENT DETAILS
    Date of Assessment Option 1 Option 2 Option 3 Option 4
           
    TIME OF ASSESSMENT
    Start:   End:  
    VENUE   Contact

    person

     
    LANGUAGE MEDIUM

    METHOD OF

     
    METHOD OF ASSESSMENT (please tick off the one to be used)
    OBSERVATION ORAL WRITTEN
    Simulation   Knowledge test   Knowledge test  
    Product   Interview      


    PRE-ASSESSMENT MEETING CHECKLIST

    ACTION YES/NO COMMENTS
    Set learner at ease; be friendly, polite, and professional.    
    Explain to the learner and agree on the

    following issues.


    1. The unit standard that will be assessed

    2. Date, time, venue, and process to be followed during the assessment.

    3. Summative assessment tools to be used for the assessment.

    4. The assessment plan

    5. Purpose of assessment

       
    Explain to the learner and agree on the

    role of all involved during the assessment

    process.

       
    Identify possible barriers and or disabilities

    of the learner.

       
    Explain the meaning and application of

    RPL.

       
    Explain, discuss and provide one complete

    set of the Appeals process documentation.

       
    Explain to the learner when the final results

    will be available and how feedback will be

    provided.

       
    Discuss previous assessment results if

    applicable.


    I, ______________________________ (initials and surname of learner), DECLARE THE FOLLOWING:


    A copy of the unit standard(s) involved has been given to me before this meeting. I know I will be assessed against the criteria, which have been set to the applicable unit standards. The requirements have been discussed with me, and the procedures and purpose of the assessment have been clearly explained to me.


    I am well aware of the venue, date, and time that I will be assessed. I consider the period given to me to prepare myself for the assessment to be fair.


    I understand clearly that I have the right to appeal against any decision made by the assessor during the assessment of the evidence provided by me, and that I have free access to the appeals procedures attached to this assessment pack. I understand that I have the right to be accompanied by another person during all procedures and that I have free access to the Training Division of SBV’S Health and safety procedures- filed at the offices.


    Signature of learner Date


    Assessment Instruments

    TAKE NOTE
    The assessment instruments included in this assessment

    pack are all summative and will

    be read in conjunction with the formative assessment instruments

    contained in the learner workbook. Both formative

    (workbook) and summative assessments are to be retained

    as part of the learner’s portfolio of evidence.


    A number of the assessment instruments contained in this assessment are workplace knowledge-based questions.


    This means that you will arrange with the learner, a suitable time, during which the learner will complete each question.


                     Answer the following question in the space provided below.


    SESSION 1.

    ACCESS, USE, AND MANAGE SUITABLE LEARNING RESOURCES.

    Learning Outcomes
    · Relevant learning resources are identified.

    · Learning resources are used effectively and managed through appropriate selection and cross-referencing of information and acknowledgment of sources.


    Task Questions Description Mark
    1 Express your understanding Use learning resources effectively through the appropriate selection of information and acknowledgment of sources 1


    SESSION 2.

    FORMULATE AND USE LEARNING STRATEGIES.

    Learning Outcomes
    · Learning strategies are formulated by a selection of specific tried techniques.

    · Information is summarized and used in the learning process.

    · Answers to relevant questions are synthesized and contextualized.

    · Texts are read/viewed for detail, interpreted, analyzed, and synthesized for a given context.

    · Verbal interaction is interpreted, analyzed, and synthesized for a given context.

    · Learning takes place through communicating with others in groups or as individuals.


    Task


    Questions Description Mark
    2 What does the summary should include 6


    Task


    Questions Description Mark
    3 Discuss the following:

    · Peer assessment

    · Self-assessment

    · Note-taking


    10


    Task Question Description Mark
    4 Outline three fundamental learning skills. 3


    Task Question Description Mark
    5 Outline the benefits of good listening 4


    Task Question Description Mark
    6 Express your full understanding of the Technical language/terminology (jargon) engaged with, and clarification sought if needed 7


    SESSION 4.

    CONDUCT RESEARCH AND ANALYSE AND PRESENT FINDINGS

    Learning Outcomes
    · Appropriate or relevant topic and scope is identified and defined.

    · Research steps are planned and sequenced appropriately.

    · Research techniques are applied.

    · Information is sifted for relevance.

    · Information is classified, categorized, and sorted.

    · Research findings are analyzed and presented in the appropriate format.

    · Conclusions and recommendations are made in the appropriate format.


    Task Questions Description Mark
    7 Express your full understanding about the following:

    · Evaluation

    · Reading/viewing:

    · Interviewing:

    · Observing:

    7


    Task Questions Description Mark
    8 Discuss the following based on the Preliminary analysis and planning of your oral presentation:

    · Questions to ask yourself:

    · Gathering and organizing information:


    15


    Task Questions Description Mark
    9 In point form express your understanding of Gathering and organizing information: 12


    SESSION 5.

    LEAD AND FUNCTION IN A TEAM.

    Learning Outcomes
    · Active leading and participation take place in group learning situations.

    · Responsibilities in the team are taken up and group work conventions are applied in learning situations.

    · Conflict management and negotiating techniques are practiced in diverse contexts.

    · Teamwork results in meaningful products, outcomes, or goals.


    Task Questions Description Mark
    10 Define the following words:

    · Excursions

    · Workshops

    · Responsibilities in the team


    12


    Task Questions Description Mark
    11 In-point forms outline the guidelines that should make the negotiation process less stressful and more successful: 12


    SESSION 6.

    REFLECT ON HOW CHARACTERISTICS OF THE WORKPLACE AND OCCUPATIONAL CONTEXT AFFECT LEARNING.

    Learning Outcomes
    · Sector and organization type are identified.

    · Features of the occupational environment are described and discussed.

    · Ways in which these features affect learning processes and application of learning are described and discussed.


    Task Questions Description Mark
    12 Describe the following:

    · National Government:

    · Provincial Government:

    · Local Government:

    9

    ______________________________________________________________________________________________________________________________________________________________________________________________________________________________________________________________________________________________________________________________________________________________________________________________________________________________________________________________________________________________________________________________________________________________________________________________________________________________________________________________________________________________________________________________________________________________________________________________________________________________________________________________________________________________________________________________________________________________________________________________________________________________________________________________________________________________________________________________________________________________________________________________________________________________________________________________________________________________________________________________________________________________________________________________________________________________________________________________________________________________________________________________________________________________________________________________________________________________________________________________________


    Task Questions Description Mark
    13 Describe the following.

    · Government organizations

    · Parastatal Organisations

    · Heavy/Light Industry

    · Large Organisations

    Small Business:

    10

    _______________________________________________________________________________________________________________________________________________________________________________________________________________________________________________________________________________________________________________________________________________________________________________________________________________________________________________________________________________________________________________________________________________________________________________________________________________________________________________________________________________________________________________________________________________________________________________________________________________________________________________________________________________________________________________________________________________________________________________________________________________________________________________________________________________________________________________________________________________________________________________________________________________________________________________________________________________________________________________________________________________________________________________________________________________________________________________________________________________________________________________________________________________________________________________________________________________________________________________________________________________________________________________________________________________


    ASSESSOR REPORT
    UNIT STANDARD ID: UNIT STANDARD TITLE CREDITS
     
    CANDIDATE NAME:


    DATE OF FEEDBACK:


    OVERALL ASSESSMENT DECISION:


    I ______________________________, the assessor, declare the candidate

    Competent / Not Yet Competent (circle relevant) on all the criteria within the assignment.


    STRENGTHS:


    WEAKNESSES:


    LEARNER COMMENTS:


    DEVELOPMENT PLAN:


    CANDIDATE DECLARATION:


    I _____________________________________, the candidate, declare that I have received feedback and been informed of my overall competence for the criteria within the assignment.


    ASSESSOR SIGNATURE                                      LEARNER SIGNATURE


    ____________________                                      ____________________


  • Answer the following question in the space provided below.


    SESSION 1.

    ACCESS, USE AND MANAGE SUITABLE LEARNING RESOURCES.

    Learning Outcomes
    · Relevant learning resources are identified.

    · Learning resources are used effectively and managed through appropriate selection and cross-referencing of information and acknowledgement of sources.


    Activity Question Description Mark
    1 Explain in detail the following:

    · General texts

    · Printed and visual media

    · Internet


    Activity Question Description Mark
    2 Express your understanding Use learning resources effectively through the appropriate selection of information and acknowledgement of sources 5


    SESSION 2.

    FORMULATE AND USE LEARNING STRATEGIES.

    Learning Outcomes
    · A selection of specific tried techniques formulates learning strategies.

    · Information is summarized and used in the learning process.

    · Answers to relevant questions are synthesised and contextualised.

    · Texts are read/viewed for detail, interpreted, analysed and synthesised for a given context.

    · Verbal interaction is interpreted, analysed and synthesised for a given context.

    · Learning takes place through communicating with others in groups or as individuals.


    Activity Question Description Mark
    3 Express your full understanding of Peer and self-assessment mind maps. 8


    Activity Question Description
    4 Outline the three main ways to take notes from written material.


    Activity Question Description Mark
    5 Outline the reasons for asking questions 8


    Activity Question Description Mark
    6 I groups express your full understanding of the following:

    · Reading for pleasure

    · Scanning:

    · Skimming:

    · Reading in detail:

    · 5 Reading critically

    17


    SESSION 3.

    MANAGE OCCUPATIONAL LEARNING MATERIALS.

    Learning Outcomes
    · Occupational learning materials are organized and used for optimum learning.

    · Learning materials’ layout, presentation and organisational features are understood and used effectively.

    · Technical language/ terminology is engaged with and clarification is sought if needed.


    Activity Question Description Mark
    7 Describe the following :

    · Charts, maps plans, diagrams and models

    · Videos/Dvd’s

    · Internet


    17


    Activity Question Description Mark
    8 Express your fully understand of the following:

    · Layout and presentation of learning materials are understood and used effectively

    · Contents page:

    · Glossaries:

    · Index:

    · Electronic texts:

    15


    SESSION 4.

    CONDUCT RESEARCH AND ANALYSE AND PRESENT FINDINGS

    Learning Outcomes
    · Appropriate or relevant topic and scope is identified and defined.

    · Research steps are planned and sequenced appropriately.

    · Research techniques are applied.

    · Information is sifted for relevance.

    · Information is classified, categorised and sorted.

    · Research findings are analysed and presented in the appropriate format.

    · Conclusions and recommendations are made in the appropriate format.


    Activity Question Description Mark
    9 Outline essential for the following:

    · Task Definition

    · Information Seeking Strategies

    5


    Activity Question Description Mark
    10 Define the following words:

    · Information is evaluated for relevance

    · Information is classified, categorized and sorted

    6


    SESSION 5.

    LEAD AND FUNCTION IN A TEAM.

    Learning Outcomes
    · Active leading and participation take place in group learning situations.

    · Responsibilities in the team are taken up and group work conventions are applied in learning situations.

    · Conflict management and negotiating techniques are practised in diverse contexts.

    · Teamwork results in meaningful products, outcomes or goals.


    Activity Question Description Mark
    11 Define the following types of meetings:

    · Status Meetings

    · Work Meetings

    · Staff meeting:

    · Team meeting

    · Ad-hoc meeting

    · Management meeting

    · Board meeting

    · One to one meeting:

    16


    Activity Question Description Mark
    12 Explain in details conflict management and negotiating techniques 6


    Activity Question Description Mark
    13 Express your full understanding about the following:

    · Teamwork that results in a meaningful product or outcomes

    · Reaching consensus

    · Task completion

    12
  • Learning Outcomes
    · Sector and organization type are identified.

    · Features of the occupational environment are described and discussed.

    · Ways in which these features affect learning processes and application of learning are described and discussed.


    1. Introduction

    Where you work (environment) and what type of work you do has an enormous influence on how receptive you are to learning. Some background knowledge on these obstacles can help you overcome them:

    1. Sector and organization type is identified

    The economy of a country is divided into different parts called sectors. These sectors are made up of different types of organizations that all have the same focus area, i.e. they all do the same type of jobs or offer the same type of services. Let us look at some of the sector’s focuses:

    Services

    The services sector of industry involves the provision of services to businesses as well as final consumers. Services may involve the transport, distribution, and sale of goods from producer to consumer as may happen in wholesaling and retailing, or may involve the provision of a service, such as in pest control or entertainment. However, the focus is on people interacting with people and serving the customer rather than transforming physical goods.

    Manufacturing

    The manufacturing sector uses tools and labor to make things for use or sale. It ranges from handicraft to high tech but is most commonly applied to industrial production, where raw materials are transformed into finished goods on a large scale.


    Construction

    The construction sector consists of the following areas:

    ⇒ infrastructure, repair, and maintenance;

    ⇒ public and private housing;

    ⇒ non-residential public property (e.g. hospitals and schools);

    ⇒ industrial (e.g. factories and processing plants) and commercial construction.

    Farming

    South Africa is divided into several farming regions according to climate, natural vegetation, soil type, and farming practices. Agricultural activities range from intensive crop production and mixed farming in winter rainfall and high summer rainfall areas, to cattle ranching in the bushveld and sheep farming in more arid regions. These agricultural activities are:

    ⇒ FIELD CROPS AND HORTICULTURE: Grain and oilseeds, sugar, fruit, wine, vegetables, cotton, tobacco, tea, and ornamental plants and cut flowers.

    ⇒ LIVESTOCK FARMING: Dairy farming, beef farming, sheep and goat farming, poultry and pig farming, game farming, and aquaculture (mussels, trout, tilapia, catfish, oysters, and waterblommetjies (Cape pondweed) are the major aquaculture species)

    ♦ Transport

    The transport sector consists of the following areas:

    ⇒ Road transport

    ⇒ Rail transport

    ⇒ Air transport

    ⇒ Sea transport

    ♦ Mining

    The mining sector involves all industries that extract raw materials (e.g. coal, ores, etc.) from the earth.

    ♦ Educational

    This sector consists of:

    ⇒ Schools (government and private)

    ⇒ Colleges

    ⇒ Universities

    ⇒ Training centers

    ⇒ Distance learning centers

    ♦ Government

    The government sector is also called the public sector because it is representative of the public. It is made up of three smaller sectors:

    ⇒ National Government: National Government’s responsibilities are everything to do with the whole country, e.g. defense, safety and security (police), health and welfare, finance, etc.

    ⇒ Provincial Government: Provincial Government’s responsibilities are everything to do with the nine provinces, e.g. provincial roads, provincial safety and security, education, etc.

    ⇒ Local Government: Local Government’s responsibilities are everything to do with the metro councils and municipalities, e.g. electricity supply, water supply, waste management, etc.

    Within these various sectors, we find different types of organizations, e.g.:

    EXAMPLE
    Government organizations: These organizations have only one shareholder – the government. Examples are National Sporting Federations, Eskom, Nelson Mandela Children’s Fund, etc.

    Parastatal Organisations: These organizations are partially state-owned. Examples are Telkom, ACSA (Airports Company South Africa), etc.

    Heavy/Light Industry: These organizations are usually privately owned and listed on the stock exchange. Examples are Mittal Steel, SASOL, PPC Cement, etc.

    Large Organisations: These organizations are privately owned and listed on the stock exchange. Examples are: Pick ‘n Pay, Media24, etc.

    Small Business: These businesses are privately owned and seldom listed on the stock exchange. Examples are Mr. Video, your local butcher, your local spaza shop, etc.


    1. Features of the occupational environment

    The features of the occupational environment consist of everything that makes up that environment – physical and psychological. The physical characteristics are always the easiest to identify and discuss because they are tangible (can be seen and touched).

    EXAMPLE
    Mining: Large machinery and equipment, lots of dirt

    and residue, seldom spacious (inside the mine), etc.

    Heavy industry: Noisy, large machinery and equipment,

    sometimes exposed to weather conditions, often

    dirty, chemicals, etc.

    Large organizations: Sometimes hi-tech but impersonal,

    lots of goods being moved around, people traffic,

    etc.

    Small business: Limited resources, limited space,

    temporary labor, etc.


    The psychological features are not always easy to identify because they are not tangible. The different perceptions of people also make psychological features difficult to generalize (they do not always apply to everyone).

    EXAMPLE
    ♦ Personality clashes

    ♦ Competitiveness

    ♦ Work

    ♦ Pressure, etc.


    1. Ways in which occupational environment features affect learning processes and application of learning.

    The environment in which one learns plays a very big role in how much learning takes place.


    EXAMPLE
    As an example, think of trying to learn in a factory, where the machines are making a lot of noise, the workers are shouting to be heard and a siren is sounding to signal that shutdown is five minutes away. Some so many distractions and obstacles will prevent learning from taking place, even though the worker has the best intentions.

    ♦ Think of a worker trying to learn how to take stock during the annual stock-take. The environment will be a hive of activity, with noise and lots of movement interrupting his/her concentration. This situation will frustrate the ‘teacher’ as well as the ‘learner’, resulting in a negative experience for the worker.

    ♦ A final example is of workers attending a course at a training center. There they get to sit at a desk in a quiet classroom and pay uninterrupted attention to the facilitator. Should they require assistance, it is available immediately.